
Many home buyers and sellers focus solely on current listings and sale prices when evaluating Oakland County real estate, but this approach misses a critical layer of insight. Census data offers a stable, comprehensive view of housing market fundamentals that current listings alone cannot provide. By understanding key demographic and housing statistics from census reports, you can make smarter decisions about pricing, timing, and neighborhood selection. This guide will show you how to interpret local census data alongside real-time market information to gain a competitive edge whether you’re buying your first home or selling a luxury property in Oakland County.
 Pro Tip: Track changes in owner-occupancy rates over multiple census periods to anticipate neighborhood stability shifts. A rising homeownership rate often precedes price appreciation, while declining rates may signal transition periods that create buyer opportunities.
These census metrics connect directly to practical real estate decisions. For example, the high homeownership rate means you’re competing primarily with other owner-occupants rather than institutional investors, which can influence negotiation strategies. Understanding the age of housing stock helps buyers budget for maintenance and helps sellers position their homes relative to neighborhood averages. By reviewing the housing market report from 2019, you can see how these census fundamentals have evolved and compare them to current conditions. The steady home equity trends in Oakland County further demonstrate how census-level stability translates into financial benefits for homeowners.
Pro Tip: Track changes in owner-occupancy rates over multiple census periods to anticipate neighborhood stability shifts. A rising homeownership rate often precedes price appreciation, while declining rates may signal transition periods that create buyer opportunities.
These census metrics connect directly to practical real estate decisions. For example, the high homeownership rate means you’re competing primarily with other owner-occupants rather than institutional investors, which can influence negotiation strategies. Understanding the age of housing stock helps buyers budget for maintenance and helps sellers position their homes relative to neighborhood averages. By reviewing the housing market report from 2019, you can see how these census fundamentals have evolved and compare them to current conditions. The steady home equity trends in Oakland County further demonstrate how census-level stability translates into financial benefits for homeowners.
 The home inventory trends show how supply constraints have evolved, while home seller tips for Oakland County explain how to capitalize on current conditions. For buyers, understanding these combined data points helps set realistic expectations and timing strategies. The census data tells you what’s structurally normal for Oakland County, while current market reports reveal temporary deviations you can exploit. When you’re ready to act, reviewing real estate tips for buyers and sellers ensures you apply both data types effectively.
 Working with professionals who understand Oakland County’s unique market dynamics ensures you’re not just reading data but applying it strategically. They can show you how choosing the right real estate agent impacts your outcomes, explain the specific benefits of using an Oakland County realtor who knows local census patterns, and guide you through the entire home buying process from start to finish with data-informed confidence. Whether you’re buying or selling, combining census insights with professional guidance gives you the complete picture needed for success in Oakland County’s competitive real estate market.
Table of Contents
- Key takeaways
- Understanding Oakland County’s housing demographics through census data
- Aligning census insights with Oakland County real estate market trends
- Neighborhood variations and economic factors influencing Oakland County housing
- Practical ways home buyers and sellers can use census data in Oakland County
- Need expert help with your Oakland County real estate journey?
- Frequently asked questions
Key Takeaways
Understanding Oakland County’s housing demographics through census data
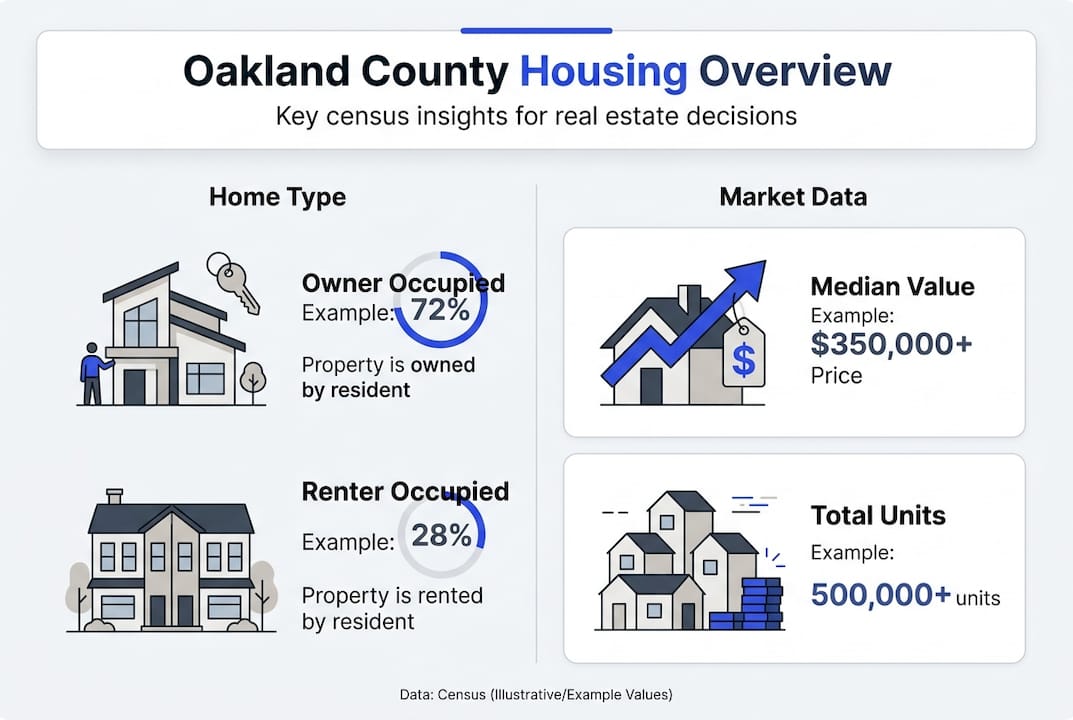
Census data provides the foundation for understanding how Oakland County’s housing market operates at a structural level. Unlike daily listing updates that fluctuate with seasonal trends, census statistics reveal long-term patterns that shape market behavior. The owner-occupancy rate sits at 72.38%, signaling a market dominated by stable, long-term residents rather than transient renters or investors. This high homeownership percentage typically correlates with better-maintained properties, stronger community engagement, and more predictable market conditions. The median home value for owner-occupied units is approximately $320,400, establishing a critical baseline for pricing expectations. This figure represents homes with mortgages and reflects what typical Oakland County homeowners have invested in their properties. When you compare this census median to current asking prices or recent sales, you can quickly identify whether a neighborhood is trading at, above, or below its historical baseline. The median construction year of 1978 tells another important story: many Oakland County homes are approaching or have surpassed 45 years old, which means buyers should anticipate potential renovation needs while sellers might consider strategic updates to compete with newer inventory. Key housing demographics that influence your real estate decisions include:- Owner-occupied units represent 72.38% of total housing stock, while renters occupy the remaining 27.62%
- Median home value with mortgage stands at $320,400, providing a pricing anchor for market analysis
- Average household size of 2.5 people suggests family-oriented communities with corresponding amenities
- Population density trends show steady growth, indicating sustained demand for housing inventory
Pro Tip: Track changes in owner-occupancy rates over multiple census periods to anticipate neighborhood stability shifts. A rising homeownership rate often precedes price appreciation, while declining rates may signal transition periods that create buyer opportunities.
These census metrics connect directly to practical real estate decisions. For example, the high homeownership rate means you’re competing primarily with other owner-occupants rather than institutional investors, which can influence negotiation strategies. Understanding the age of housing stock helps buyers budget for maintenance and helps sellers position their homes relative to neighborhood averages. By reviewing the housing market report from 2019, you can see how these census fundamentals have evolved and compare them to current conditions. The steady home equity trends in Oakland County further demonstrate how census-level stability translates into financial benefits for homeowners.
Aligning census insights with Oakland County real estate market trends
Census data provides the foundation, but real-time market data reveals how current conditions are playing out. Median sale prices in late 2025 and early 2026 range from $350,000 to $360,000, running slightly higher than the census median home value of $320,400. This gap reflects several factors: inflation since the last comprehensive census update, improvements homeowners have made to properties, and strong buyer demand pushing prices upward. The current market operates as a seller’s market with inventory levels hovering around 3 to 4 months of supply, well below the 6-month threshold that defines a balanced market. When you layer census demographics over current market dynamics, patterns emerge that single data sources miss. The stable 72% homeownership rate from census data explains why inventory remains tight: most Oakland County residents are long-term homeowners who aren’t forced to sell quickly. Meanwhile, population growth documented in census reports fuels ongoing demand that keeps prices elevated. This combination creates the competitive conditions buyers face today, where understanding both the historical baseline and current momentum becomes essential for crafting winning strategies. Factors affecting current market dynamics include:- Inventory shortage driven by long-term homeowner stability and limited new construction
- Population growth creating sustained demand that outpaces available supply
- Economic influences including employment growth in metro Detroit and remote work flexibility
- Shifting neighborhood appeal as buyers prioritize different amenities post-pandemic
💡 Pro Tip — Tom Gilliam RE/MAX Classic
Use the census median as your negotiation anchor when making offers. If a home is listed significantly above both the census baseline and current MLS median, you have data-backed justification for a lower offer — especially if the property needs updates typical of its age cohort.
Neighborhood variations and economic factors influencing Oakland County housing
County-wide averages from census data provide valuable context, but Oakland County’s real estate market operates with significant neighborhood-level variation. Census data shows steady overall population and housing growth across the county, yet individual communities experience different trajectories. Farmington Hills has seen some softening in sales volume and prices compared to rising trends in other Oakland County areas, demonstrating how local economic and demographic factors create sub-markets within the larger county picture. These variations occur because census data captures a snapshot in time, typically lagging current conditions by one to three years depending on the survey. The American Community Survey updates more frequently than the decennial census, but even these updates cannot capture rapid shifts like a major employer relocating to a specific township or a new development changing neighborhood character. Smart buyers and sellers use census data as their baseline understanding, then overlay current local intelligence to identify where opportunities exist. Key economic and demographic factors influencing sub-markets include:- Employment shifts as companies relocate or expand in specific Oakland County communities
- New residential and commercial developments changing neighborhood density and amenities
- School district performance variations affecting family buyer preferences and willingness to pay premiums
- Infrastructure improvements like road expansions or public transit affecting accessibility and desirability
- Start with census data to establish the neighborhood’s historical baseline for homeownership rates, median values, and demographic composition
- Review current MLS data for the same neighborhood to identify how recent sales compare to the census baseline
- Calculate the variance between census median and current median to determine if the neighborhood is appreciating faster or slower than county averages
- Research local news and development plans to understand what’s driving any significant deviations from census baselines
- Consult with local real estate professionals who can explain neighborhood-specific factors that raw data doesn’t capture
Practical ways home buyers and sellers can use census data in Oakland County
Census data becomes powerful when you translate statistics into actionable real estate strategies. Start by cross-referencing census median home values with current Multiple Listing Service data for your target neighborhoods. If the census shows a median of $320,400 but current listings average $380,000, you’re looking at either significant appreciation or potential overpricing depending on property conditions and market momentum. This comparison helps buyers avoid overpaying and helps sellers price competitively without leaving money on the table. Steps for incorporating census insights into your buying or selling strategy:- Identify your target neighborhoods and pull census data for homeownership rates, median values, poverty levels, and population density
- Compare census medians to current MLS median sale prices to calculate appreciation rates and identify value gaps
- Assess neighborhood stability by reviewing owner-occupancy trends across multiple census periods
- Evaluate demand indicators like population growth and household formation rates that signal future price pressure
- Cross-check census age of housing stock with current listings to identify properties that may need updates or offer move-in-ready value
- Use poverty rates and median household income from census data to gauge neighborhood economic strength and pricing sustainability
Need expert help with your Oakland County real estate journey?
Interpreting census data alongside current market conditions requires local expertise and years of experience reading between the numbers. Your real estate agent can help you understand what census demographics mean for specific properties you’re considering, whether stable homeownership rates justify premium pricing, and how population trends will affect your investment over time. Expert agents know which neighborhoods are transitioning, where census data might be outdated due to rapid development, and how to position your offers or listings for maximum advantage.
Working with professionals who understand Oakland County’s unique market dynamics ensures you’re not just reading data but applying it strategically. They can show you how choosing the right real estate agent impacts your outcomes, explain the specific benefits of using an Oakland County realtor who knows local census patterns, and guide you through the entire home buying process from start to finish with data-informed confidence. Whether you’re buying or selling, combining census insights with professional guidance gives you the complete picture needed for success in Oakland County’s competitive real estate market.
Frequently asked questions
How current is the census data used for Oakland County real estate analysis?
The most recent comprehensive census data comes from the 2020 decennial census, while the American Community Survey provides annual updates with one, three, and five-year estimates. This means census housing data typically lags current conditions by one to three years depending on which survey you reference. The lag doesn’t diminish its value for establishing baseline trends and long-term patterns that shape market fundamentals. Combining census baselines with real-time MLS reports and current listings gives you both historical context and up-to-date market conditions, creating a complete analytical framework for decision making.Can census data predict future property values in Oakland County?
Census data provides foundational demographic and economic context that influences long-term value trends but cannot predict short-term price fluctuations on its own. Factors like population growth, rising homeownership rates, and increasing median household incomes from census data suggest positive long-term conditions for appreciation. However, immediate price movements depend on inventory levels, interest rates, local economic events, and buyer sentiment that census data doesn’t capture. Use census insights to identify neighborhoods with strong fundamentals, then combine them with current market analysis and professional advice for more accurate near-term forecasting.How can I use census data to find the best neighborhood in Oakland County?
Start by comparing owner-occupancy rates across different Oakland County communities, as higher rates typically indicate greater stability and resident investment in the area. Review median home values to identify neighborhoods that align with your budget while offering appreciation potential. Check poverty levels and median household incomes to gauge economic strength and sustainability of current pricing. Population density trends reveal whether neighborhoods are growing or declining, helping you avoid areas losing appeal. Cross-reference these census metrics with current real estate listings, school ratings, and community amenities for a complete evaluation that balances data with lifestyle preferences.What’s the best source for accurate Oakland County census data?
The U.S. Census Bureau’s official website at census.gov provides the most authoritative demographic data through both decennial census results and ongoing American Community Survey reports. For housing-specific statistics, the Census Bureau’s QuickFacts tool offers easy access to key metrics like homeownership rates, median values, and household characteristics. Local county records and planning department reports supplement federal census data with more granular neighborhood information. Trusted real estate market reports from local boards of realtors and MLS systems provide the current transaction data needed to contextualize census baselines, creating a comprehensive information foundation for your real estate decisions.Recommended
Check out this article next